
Key points
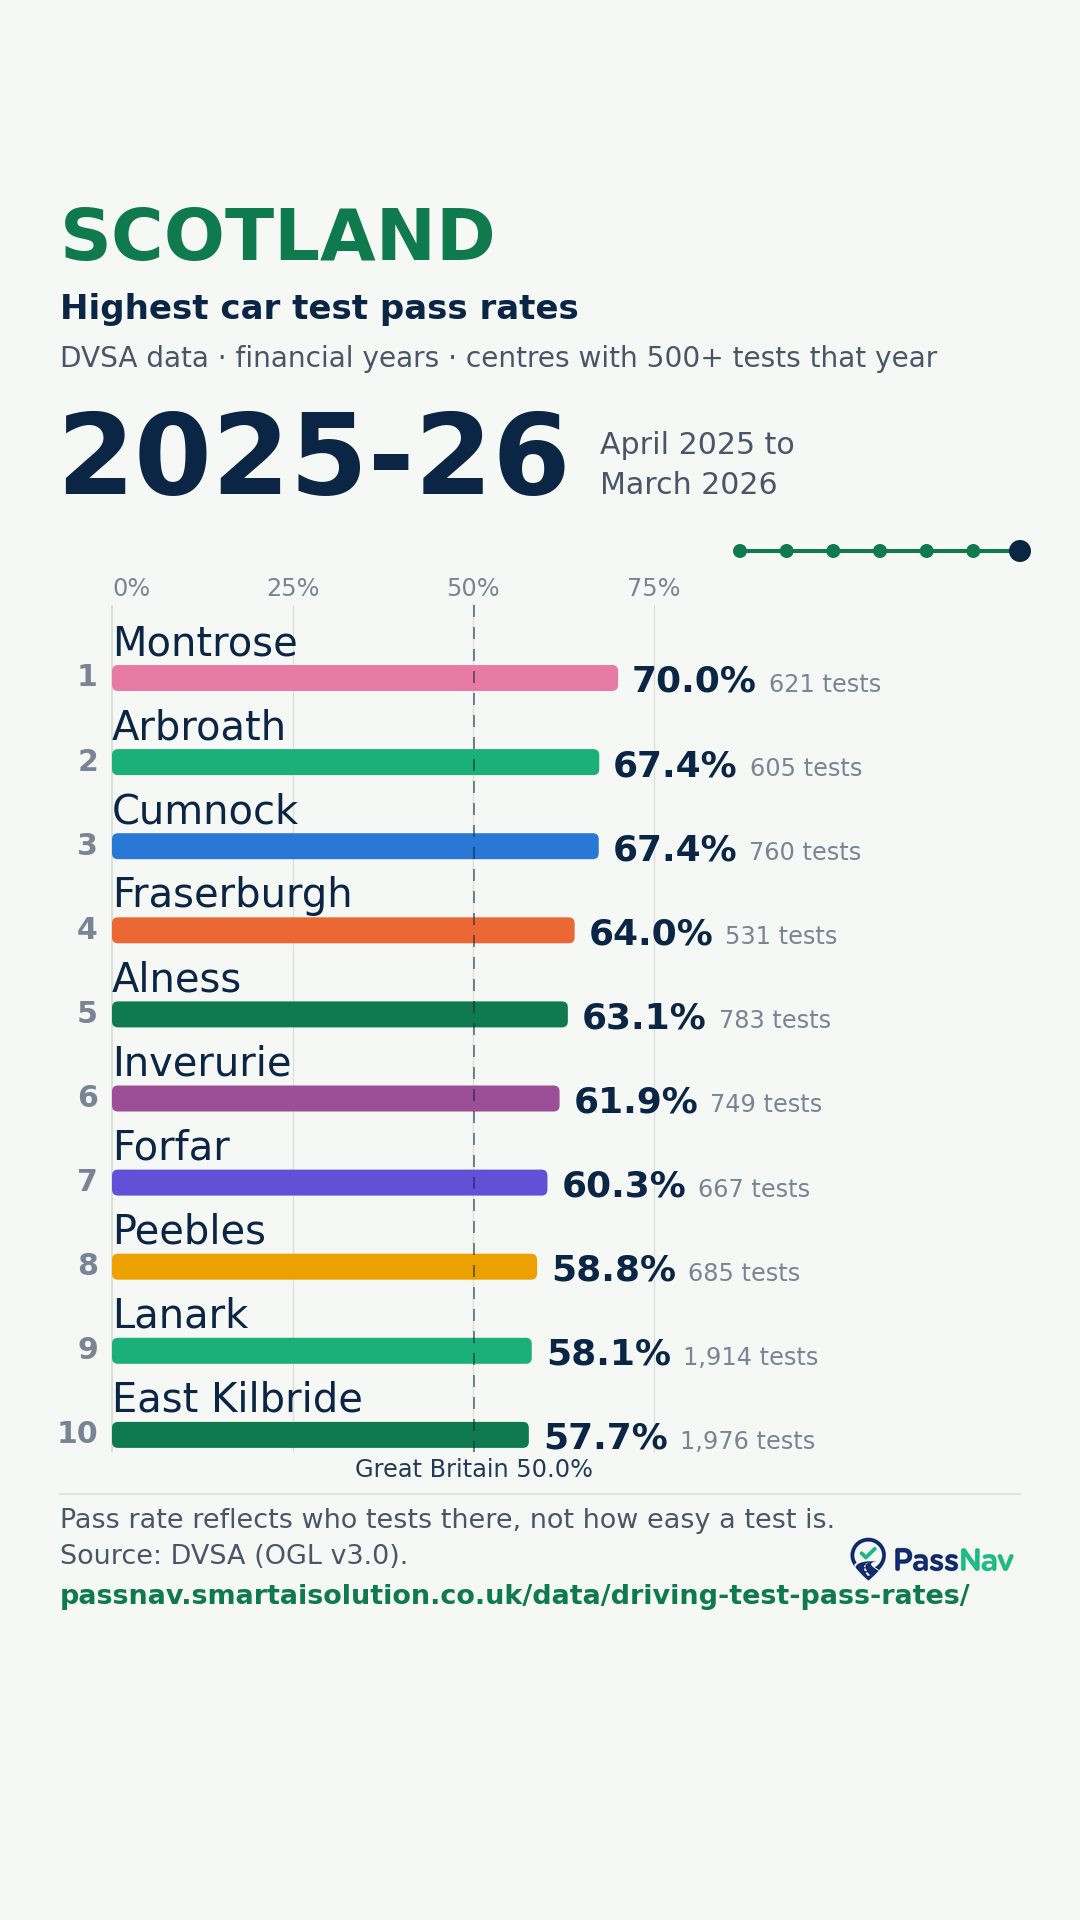
- In 2025-26, 760 car practical tests were conducted at Cumnock and 67.4% were passes — 17.3 percentage points above the Great Britain rate of 50.0%.
- Figures come from DVSA's published statistics (financial years, April to March).
- A centre's pass rate reflects who tests there as well as its roads — it doesn't tell you how easy or hard the test is.
Pass rate over time
Show the data as a table
| Year | Tests | Passes | Pass rate | GB rate |
|---|---|---|---|---|
| 2007-08 | 729 | 418 | 57.3% | 44.2% |
| 2008-09 | 759 | 416 | 54.8% | 45.3% |
| 2009-10 | 789 | 448 | 56.8% | 45.9% |
| 2010-11 | 564 | 300 | 53.2% | 46.3% |
| 2011-12 | 512 | 309 | 60.4% | 46.9% |
| 2012-13 | 759 | 445 | 58.6% | 47.1% |
| 2013-14 | 940 | 506 | 53.8% | 47.1% |
| 2014-15 | 1,087 | 517 | 47.6% | 46.9% |
| 2015-16 | 1,118 | 551 | 49.3% | 47.0% |
| 2016-17 | 1,084 | 572 | 52.8% | 47.1% |
| 2017-18 | 1,028 | 566 | 55.1% | 46.3% |
| 2018-19 | 1,045 | 608 | 58.2% | 45.8% |
| 2019-20 | 954 | 552 | 57.9% | 45.9% |
| 2020-21 | 164 | 105 | 64.0% | 49.8% |
| 2021-22 | 763 | 478 | 62.6% | 48.9% |
| 2022-23 | 554 | 323 | 58.3% | 48.4% |
| 2023-24 | 979 | 568 | 58.0% | 47.9% |
| 2024-25 | 906 | 554 | 61.1% | 48.7% |
| 2025-26 | 760 | 512 | 67.4% | 50.0% |
By gender, 2025-26
| Tests | Pass rate | |
|---|---|---|
| Male | 368 | 67.9% |
| Female | 392 | 66.8% |
First attempts and automatic cars, 2025-26
| Tests | Pass rate | GB rate | |
|---|---|---|---|
| First attempts | 459 | 69.5% | 50.5% |
| Automatic cars | 166 | 56.0% | 44.6% |
First attempts: tests taken by people sitting the car practical test for the first time (DVSA table DRT122C). Automatic: tests taken in an automatic car (DRT122E).
Pass rate by age (17 to 25), 2025-26
Show the data as a table
| Age | Tests | Pass rate |
|---|---|---|
| 17 | 167 | 79.6% |
| 18 | 127 | 63.8% |
| 19 | 55 | 80.0% |
| 20 | 32 | 75.0% |
| 21 | 25 | 72.0% |
| 22 | — | 46.7% |
| 23 | — | 61.5% |
| 24 | — | 52.4% |
| 25 | — | 66.7% |
Waiting times, Sep 2026
Show the data as a table
| Month | Median wait | Weeks to 10% availability | Taken within 7 weeks | Waited over 21 weeks |
|---|---|---|---|---|
| Oct 2024 | 10.9 weeks | 14.3 weeks | 30.9% | 4.3% |
| Nov 2024 | 10.7 weeks | 17.0 weeks | 26.0% | 7.8% |
| Dec 2024 | 12.0 weeks | 16.8 weeks | 22.4% | 6.9% |
| Jan 2025 | 14.1 weeks | 12.3 weeks | 9.0% | 7.5% |
| Feb 2025 | 15.4 weeks | 18.5 weeks | 18.7% | 4.0% |
| Mar 2025 | 15.4 weeks | 23.6 weeks | 22.7% | 6.8% |
| Apr 2025 | 15.1 weeks | 14.8 weeks | 22.2% | 9.9% |
| May 2025 | 15.4 weeks | 24+ weeks | 23.2% | 15.9% |
| Jun 2025 | 16.1 weeks | 24+ weeks | 13.8% | 7.5% |
| Jul 2025 | 17.0 weeks | 21.0 weeks | 19.4% | 11.1% |
| Aug 2025 | 17.0 weeks | 20.8 weeks | 9.4% | 10.9% |
| Sep 2025 | 18.0 weeks | 13.0 weeks | 15.7% | 19.3% |
| Oct 2025 | 17.7 weeks | 12.8 weeks | 21.8% | 34.5% |
| Nov 2025 | 21.4 weeks | 8.5 weeks | 5.2% | 53.4% |
| Dec 2025 | 22.0 weeks | 12.6 weeks | 13.8% | 55.2% |
| Jan 2026 | 19.7 weeks | 12.0 weeks | 4.3% | 44.7% |
| Feb 2026 | 20.1 weeks | 19.5 weeks | 10.7% | 44.6% |
| Mar 2026 | 19.4 weeks | 24+ weeks | 13.6% | 36.4% |
| Apr 2026 | 21.1 weeks | 24+ weeks | 7.0% | 51.2% |
| May 2026 | 22.3 weeks | 24+ weeks | 10.3% | 59.0% |
| Jun 2026 | 20.9 weeks | 19.0 weeks | 10.8% | 49.4% |
| Jul 2026 | 21.6 weeks | 10.0 weeks | 8.5% | 50.8% |
| Aug 2026 | 21.6 weeks | 8.6 weeks | 20.3% | 46.9% |
| Sep 2026 | 23.0 weeks | — | 15.5% | 67.2% |
Other test centres in Scotland
Busiest centres in the same DVSA region, with their 2025-26 pass rate. All 74 Scotland centres, with waiting times.
- Glasgow (Baillieston) 47.4%
- Paisley 48.6%
- Glasgow (Shieldhall) 39.9%
- Edinburgh (Musselburgh) 49.4%
- Edinburgh (Currie) 41.6%
- Bishopbriggs 49.8%
- Glasgow (Anniesland) 44.3%
- Hamilton 42.0%
- Dunfermline (Vine) 36.4%
- Irvine 55.7%
Preparing for a test at Cumnock
DVSA doesn't publish test routes, and examiners can vary them. What helps is being comfortable with the kinds of roads around the centre — junctions, roundabouts, lane choices and speed-limit changes — and with following a sat-nav or road signs during independent driving. For the official address and facilities, use GOV.UK's find a driving test centre service.
More: what happens on the test · top 10 fail reasons · GB pass rates · waiting times
Practising for a test at Cumnock?
PassNav hires out TomTom sat-navs — the same brand the examiner uses — pre-loaded with practice routes for 40+ test centres. Tell us your centre when you book: if we can't prepare quality routes for it, we'll tell you and refund in full before anything ships.
See plans Ask about CumnockSources
- Car driving test pass rates by gender and month: test centres (DRT122A)
- Car driving tests conducted, passed and pass rates by financial quarter and financial year: Great Britain (DRT121A)
- Car driving test pass rates by first driving attempt and gender, including zero faults: test centres (DRT122C)
- Automatic car driving test pass rates by gender: test centres (DRT122E)
- Car driving test pass rates by age (17 to 25 year olds) and year: test centres (DRT122D)
- Car driving test waiting times and availability by driving test centre, January 2019 to date: Great Britain (DRT122F)
- Car driving test waiting times and availability by country and region, January 2019 to date: Great Britain (DRT121G)
Last checked against the cited sources on 14 October 2026. PassNav is an independent service and is not affiliated with or endorsed by DVSA, DVLA or TomTom. Our guides are prepared with AI assistance and checked against the official sources cited on each page. Rules and fees change — for current legal requirements and booking rules, always check GOV.UK. This is general guidance and does not replace professional driving instruction. Figures are published historical statistics, not live test availability, and a centre's pass rate is not a measure of how easy or hard its test is. Spotted something out of date? Email passnav@smartaisolution.co.uk — see our editorial policy.